
Everything what is known about otters in Naliboki Forest: a quite scientific report
- Vadim Sidorovich

- Mar 21, 2020
- 9 min read
Updated: Apr 2, 2020
In the terrain of Naliboki Forest otters lived along the whole diversity of waterbodies such as rivers and drainage canals with different rate of water content, the Kroman’ lake, floodplain lakes in the Biarezina and Nioman valleys, ponds in abandoned peateries, numerous inundations by beavers and fire ponds, but the species distribution was fairly uneven. There were gained quite a lot of data on the otter distribution and population density that are represented in Maps and Graph.


Between-year changes in the density (inds per 10 km of stream stretch) of otters along the Vol'ka river in Naliboki Forest in 1982-2011.
In the period of 1985-2008 the highest population density of otters was found in Biarezina characterized by the best habitat quality for the species. There, from 6.2 to 8 individuals were registered along 10 km of the river on average in a particular year. The Nioman river, which edges the Naliboki Forest from the south, is bigger than the Biarezina river, but at present there are few trees growing on its banks that is quite unfavourable for otters. Therefore, in 1985-2008 the otter population density along Nioman river was markedly lower compared to the Biarezina river – about 3-6 individuals per 10 km of the river stretch. At the same time, small rivers with a natural riverbed, which were not canalized during the draining of the 1960s-1980s, were characterized by lower numbers of otters than that in the Biarezina valley: Vol’ka, 1983-2008 – 1.8-4.2, mean 3.3 individuals per 10 km of the river stretch; Vusa from the Rudnja Pil’nianskaja village to the Rudnia Nalibotskaja locality – in the winter of 1993-1994 there were 4.6 individuals per 10 km of the river stretch and in the winter 2002-2003 there were 5.3 individuals per 10 km of the river stretch; the Izliedz’ upstream in 1985-2007 – 1.7-4.9, mean 3.1 individuals per 10 km of the river stretch; the Pawnochnaja Kamienka upstream (that has the source at the Kamienka village) – in the winter of 1993-1994 there were registered 2.2 individuals per 10 km of the river stretch and in the winter of 2002-2003 there were registered 2.5 individuals per 10 km of the river stretch. The otter population density was markedly lower along the canalized small rivers: Sivichanka in 1983-2007 – 0.7-2.9, mean 1.8 individuals per 10 km of the river stretch; Pruzhenitsa in 1985-2009 – 0.3-4.2, mean 2.6 individuals per 10 km of the river stretch; Zhawtsianka in 1985-2007 – 0.5-3.5, mean 2.2 individuals per 10 km of the river stretch. Drainage canals, which were created without presence of a natural stream nearby and directed just across a swamp, were less frequently populated by otters especially in winter.
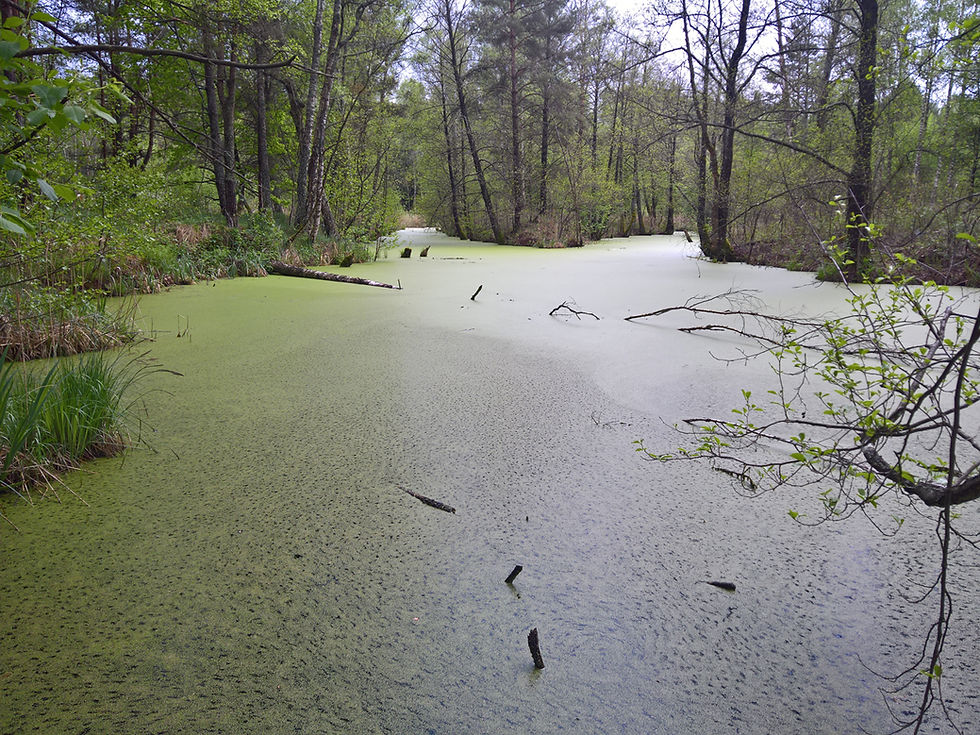
In 1982-1988 in Naliboki Forest I and friend of mine Siarhiej Saluk began to study on otters. Below you may see photos of us during the study in Naliboki Forest, our first photos of otters taken in Naliboki Forest at small rivers of Vol'ka, Al'shanitsa and Sivichanka. Also two photos of Vol'ka river that time are given.


In Naliboki Forest otter diet was traced in three model habitats with different rate of water content and prey supply: a brook – the Izliedz’ upstream, a small river – the Vol’ka downstream, a medium-sized river – Biarezina. Concerning supply with fish, the fish biomass was very low in the Izliedz’ upstream (warm season, hereafter WS – 42-331, mean 208 g/100 m of the stream stretch; cold season, hereafter CS – 110-153, mean 137 g/100 m), it was medium in the Vol’ka downstream (WS – 402-1993, mean 961 g/100 m; CS – 207-1475, mean 824 g/100 m), and there was high supply with fish in the Biarezina river (approximately higher than 7 kg per 100 m). Common frog numbers were similar in the valley of Izliedz’ upstream and the valley of Vol’ka downstream: WS, May-June – on average 0.26 and 0.31 individuals per 10 square meters of the valley, respectively; CS – 1243-2405(1777) and 162-4937(1984) g per 100 m of the stream stretch, respectively. There is much support that common frog density was higher in Biarezina valley – in May-June on average 0.79 individuals per 10 square meters of the valley. During the long-term period of studies (1982-2005) an outbreak in narrow-clawed crayfish Astacus leptodactylus was registered only in 1989-1993, whereas before and after this period the narrow-clawed crayfish population was at very low density. Both increase and decrease in narrow-clawed crayfish happened suddenly and the change rate was considerably high (approximately more than in 1000 times). In the years of population outbreak narrow-clawed crayfish were plenty everywhere (especially in the Biarezina river), while during crash in narrow-clawed crayfish population we could not find any individual. At the same time, otters preyed upon narrow-clawed crayfish seldom that indicated the species presence in the habitats. With the respect of the above-mentioned differences in the prey supply we studied on the otter diet in Naliboki Forest.
Now you see census of aquatic prey of otters by special net equipment that was fulfilled in the mid-2000s in Naliboki Forest.


To investigate that in the model aquatic habitats, 1497 scats were gathered and analysed. In conditions of low density in the narrow-clawed crayfish population otters mostly relied on fish (16.8-76.2, mean 43.0% of frequency of occurrences, hereafter %FO, 33.4-97.2, mean 69.7% of biomass consumed, hereafter %BC) and frogs (6.3-65.2, mean 37.2%FO, 0.9-57.4, mean 21.7%BC). In the warm season otters fed on fish more frequently, but less often on frogs. In both the warm and cold seasons fish consumption grew with increase in water content of rivers: WS – from 40.1 to 97.2%BC; CS – from 33.4 to 95.4 %BC, while consumption of frogs decreased with increase in water content of rivers: WS – from 34.1 to 0.9%BC; CS – from 57.4 to 4.6%BC.
In conditions of narrow-clawed crayfish outbreak otters relied on narrow-clawed crayfish (31.9-51.7, mean 41.9%FO, 21.8-57.0, mean 32.7%BC), fish (9.1-35.5, mean 24.5%FO, 11.8-76.4, mean 50.2%BC) and frogs (5.7-37.6, mean 21.8%FO, 1.4-28.3, mean 12.2%BC). In the warm season in small river (the Vol’ka downstream) and brook (the Izliedz’ upstream) otters fed on fish more frequently, but less often on frogs. The consumption of narrow-clawed crayfish was similar year-round. Again, as in the situation of narrow-clawed crayfish crash, during its population outbreak in both the warm and cold seasons fish consumption grew with increase of water content of rivers: WS – from 22.5 to 74.7 %BC; CS – from 11.8 to 76.4 %BC, while consumption of frogs decreased with increase of water content of rivers: WS – from 17.7 to 1.4 %BC; CS – from 28.3 to 1.7 %BC. Concerning narrow-clawed crayfish, its taking by otters was more frequent in medium-sized river (Biarezina) and brook (Izliedz’ upstream).


Otters at canal bank


Otters at grooming spot for drying and sleeping mainly.
To reveal the changes in diet and population density of the otter in connection with canalizing of small rivers and draining of swamps in Naliboki Forest (that was mainly conducted in 1960s and 1970s), five model small rivers from the Vol’ka catchment were used for comparison: (1) part of the Vol’ka small river with natural riverbed 34 km long; (2) part of the Izliedz’ small river with natural riverbed 14 km long; (3) the Sivichanka small river with canalized riverbed 15 km long; (4) the Pruzhenitsa small river with canalized riverbed 16 km long; (5) the Zhawtsianka small river with canalized riverbed 22 km long. Presumably the investigated part of Vol’ka, Izliedz’, Sivichanka, Zhawtsianka and Pruzhenitsa were more or less similar small rivers before three of them had been canalized. Also, in Naliboki Forest we censused otters in 17 more comparable small rivers with natural and canalized riverbeds that belonged to the Biarezina medium-sized river catchment.
Estimates of aquatic prey biomass in the variety of natural and deteriorated habitats were an important part of the studies. Therefore, aquatic prey were censused in 83 river stretches and beaver ponds by special net equipment (Sidorovich, 2011). In summer (June-August) the total biomass of aquatic prey (fish, crayfish, edible frogs and relatively big aquatic beetles) on 100 m stretches of the Vol’ka and Izliedz’ small rivers varied from 0.3 to 2.4 kg and was on average 1.0 kg. Fish made up the main part (74-92%) in the aquatic prey biomass. In the Sivichanka, Zhawtsianka and Pruzhenitsa canalized small rivers (out of beaver ponds) the total biomass of aquatic prey was up to 0.4, on average 0.05 kg per 100 m stretches (20 fold lower) and fish comprised 34-98% in biomass of aquatic prey captured. In the beginning of the cold season (November) in the Vol’ka and Izliedz’ small river the total biomass of aquatic prey (fish, crayfish, hibernating edible and common frogs, relatively big aquatic beetles) varied from 1.6 to 9.6 (mean 3.4) kg per 100 m stretches versus 0.07-3.2 (mean 0.7) kg per 100 m stretches in the Sivichanka, Zhawtsianka and Pruzhenitsa canalized small rivers (out of beaver ponds), i.e. 4.9 fold lower. In case of the small rivers with a natural riverbed fish made up 22-31% of census catches, common frogs – 64-73%, whereas in the canalized small rivers – 3-11% and 89-96%, respectively.

From the abundance of data on census of otters I concluded that the species population in Naliboki Forest markedly declined after the deterioration of the terrain with draining.
Later in 1995-1998 and especially in 2006-2007 we recorded intensive expansion of beavers into the Vol’ka catchment and, particularly, in the canalized small rivers and other drainage canals. There was registered further growth of the beaver population there until 2010; density of beaver settlements increased approximately 10-50% in different localities (on average about 30%) there in comparison with the situation in 2006-2007. Having data on aquatic prey biomass in beaver ponds, we estimated that in 2006-2007 compared to the situation in 1982-1986 the creation of numerous ponds by beavers led to great increase in aquatic prey biomass in all model small rivers: Vol’ka, WS – 2 fold; Izliedz’, WS – 14 fold; Sivichanka, WS – 329 fold; Pruzhenitsa, WS – 779 fold; Zhawtsianka, WS – 924 fold; Vol’ka, CS – 3 fold; Izliedz’, CS – 5 fold; Sivichanka, CS – 39 fold; Pruzhenitsa, CS – 44 fold; Zhawtsianka , CS – 69 fold.
In the conditions of the considerable increase in aquatic prey biomass, the diets of the otter changed markedly. Frequency of occurrences of fish in otter scats grew in both canalized small rivers and small rivers with natural riverbed in the warm and cold seasons. If before the beaver expansion otters mainly took the dace, perch, mud loach, pike, roach, stone loach and three-spined stickleback (in order of importance), then afterwards the predator species mainly preyed on the pike, roach and mud loach, while perch, three-spined stickleback and the stone loach became rare in otter catches. Respectively, the consumption of amphibians by otters declined there. In the situation of greatly increased aquatic prey biomass and improved diets (lower consumption of subcaloric amphibians) the numbers of otters grew along all model small rivers both with natural riverbed and canalized one. The catchment extended into an area of 500 square kilometers (31 by 16 km) had about 380 kilometers of small watercourses such as small rivers and main forest drainage canals (excluding shallow canals). During the winter of 1982-1983, 19 beaver ponds and 22 otter locations (hereafter, an otter location means the particular place inhabited by either lone otter or family group of otters) were recorded (Map 1). In the winter of 1997-1998, during the similar survey, 187 beaver ponds and 52 otter locations were found (Map 2), and in the 2002-2003 winter, the populations increased again with 447 beaver ponds and 57 otter locations being recorded (Map 3). So, during twenty years a three fold increase in the otter numbers was reported, which coincided with a 24 fold increase in the development of damming by beavers.

1982-1983

1997-1998

2002-2003

Otters at small beaver dams.

After the quite long period of the described more or less stability in otters in Naliboki Forest the otter population has suddenly declined manyfold by autumn 2008. As you see from the distribution map during the winter 2005-2006 in Naliboki Forest on an area of 2750 square kilometers about 580 otters lived. In December 2008 during the inspection of approximately 60-70% of the habitats only 8 otters were registered. Otter survey that was gradually undertaken in other areas in Belarus in 2009-2010 evidenced that the otter population was crashed countrywide. The fast decrease in numbers and findings of dead otters suggested an epidemic in the population.


Distribution of otters in 2005-2006 (the map at the left) and in 2009-2010 after the decline in otters (the map at the right).
Nevertheless, with relatively low possibilities to identify the disease in Belarus and not fresh enough carcasses discovered the disease hypothesis could not be directly confirmed. The simultaneous strong and fast decline in American minks in Naliboki Forest suggested the presence of a dangerous disease in the both species populations. Possibly this disease penetrated to the wild from captive American minks that were still kept in the numerous fur-bearing farms in Belarus.
Since 2011 we noticed that the otter population started to recover in Naliboki Forest, and in 2014 it reached about 30-50% of its former population number. For instance, along the Vol’ka small river the otter population density varied between one and 2 per 10 km of the river stretch, while in the Biarezina valley it was about 2-4 otters per 10 km of the river stretch. In the summer and early autumn of 2015 fairly dense population of otters in Naliboki Forest was registered countrywide. However, in November-December 2015 the otter population declined rapidly again. In the spring of 2016 there were not more than 40 otters (more likely to say 30-35 inds) in the whole Naliboki Forest on the area that is a bit larger than two thousands square km.
Since 2016 the local otter population recovered in Naliboki Forest, and during the winter of 2019-2020 otters were fairly common there. It looked like there were 3-6 otters per 10 km of stretch of the main watercourses e.g. such as the rivers of Biarezina, Vusa and Volka or Shubin-Nioman canal.


Comments